Harness the Combinatoric Power of Command-Line Tools and Utilities
Monitor Your Web Apps with Updo
Published January 31, 2026
Introduction
If you want a basic way to monitor uptime of your web sites and applications, Updo gives you a lightweight and powerful way to do that. You can test individual URLs on an interval, use different request methods, and even build a configuration file with different settings for each site you want to monitor.
Install Updo on macOS with Homebrew:
brew install owloops/tap/updoOn Ubuntu and Debian, install with dpkg:
curl -L -O https://github.com/Owloops/updo/releases/latest/download/updo_VERSION_linux_amd64.debsudo dpkg -i updo_VERSION_linux_amd64.debReplace VERSION with the actual version number.
Or, if you have Docker, build your own image:
docker build -t updo https://github.com/Owloops/updo.gitIf you use Docker, prefix commands with docker run
Test a Site
The basic command to monitor a site is
updo monitor https://example.comThis presents a full terminal UI that shows details about the uptime and tests:
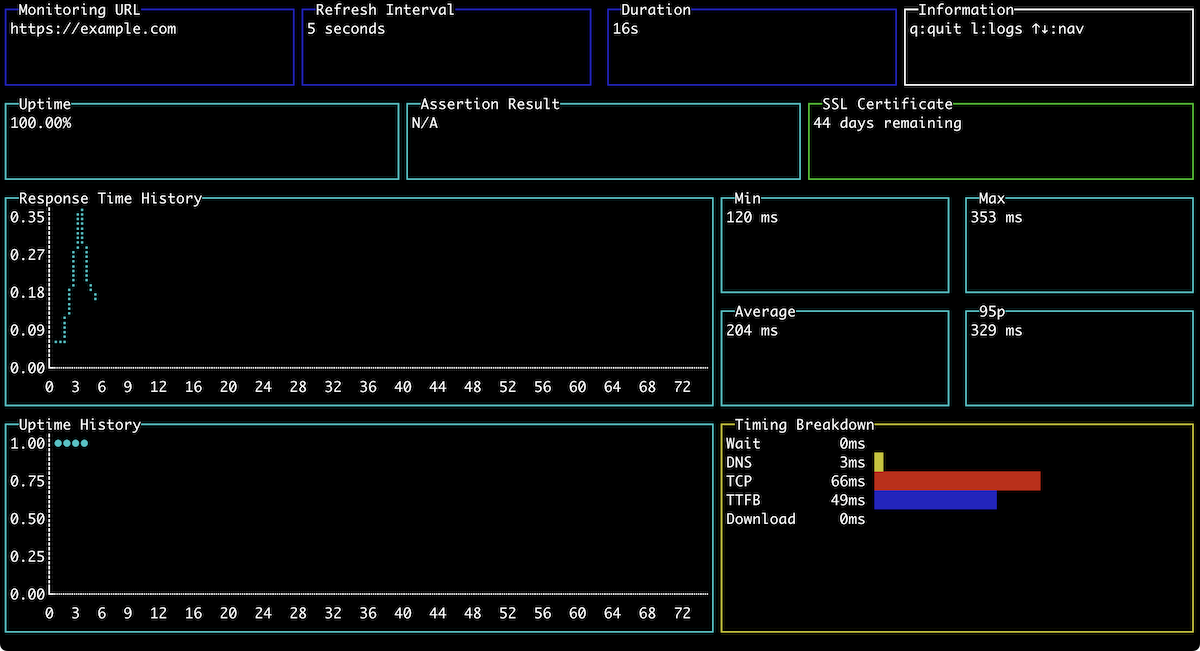
Press q to quit the user interface.
The default settings check the specified site ever 5 seconds an unlimited number of times. But you can override that. Run the following command to test the site 5 times, 10 seconds apart:
updo monitor --refresh 10 --count 5 https://example.comThe command runs and the UI exits at the end of the fifth retry.
You can use updo to test your APIs too. You can pass headers and request bodies:
updo monitor --request POST --header "Content-Type: application/json" --data '{"test":"data"}' https://api.example.comTesting More Than One Site
You can create a configuration file that contains settings for multiple sites and endpoints. Here’s one that monitors two sites and an API endpoint. Create the file site-config.conf and add the following code:
[global]
refresh_interval = 10
timeout = 10

[[targets]]
url = "https://google.com"
name = "google"
assert_text = "google"

[[targets]]
url = "https://amazon.com"
name = "amazon"
assert_text = "amazon"

[[targets]]
url = "https://api.example.com/health"
refresh_interval = 30
name = "API"
method = "POST"
headers = ["Authorization: Bearer token"]
This monitors Google, Amazon, and an example API endpoint that doesn’t work. You can set global options like the refresh_interval but then override them for specific targets. The name field is what gets displayed in the UI, and the assert_text field is what gets displayed in reports.
Save the file and use the --config-file option to specify the configuration you just created:
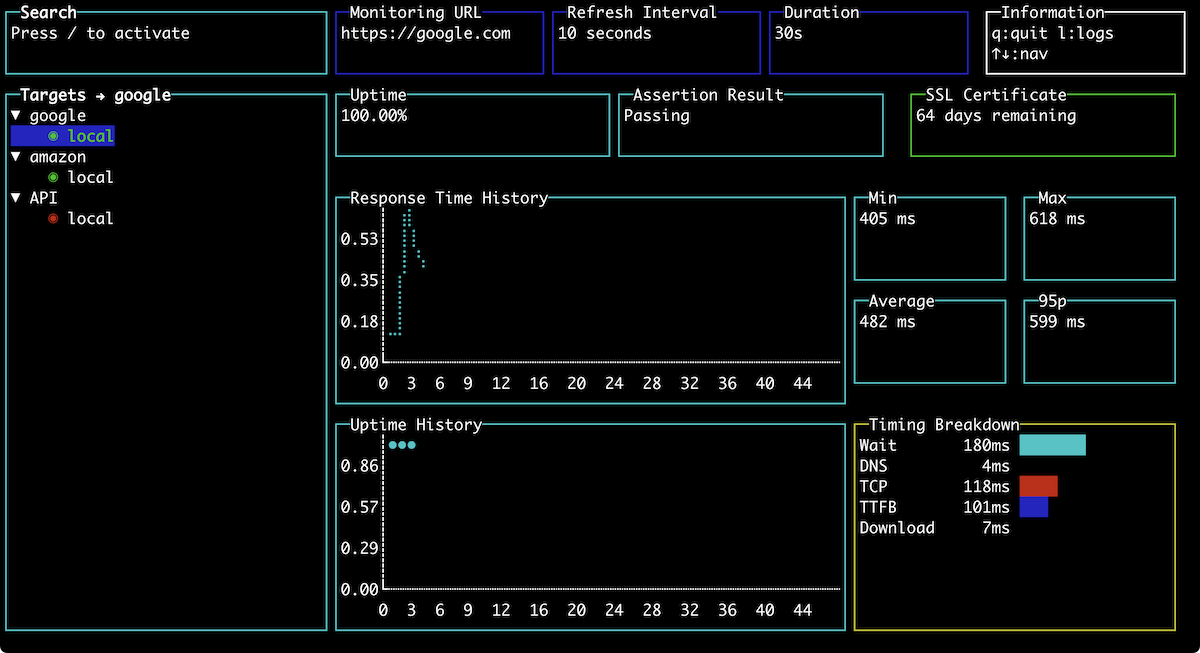
$ updo monitor --config site-config.conf --simple
When you run the command, the UI shows you all of your specified targets. Use the arrow keys to navigate between them.
If you want to monitor without the UI, use the --simple flag:
updo monitor --config site-config.conf --simpleThis time Updo streams results back to your terminal:
UPDO monitoring:
google: https://google.com
amazon: https://amazon.com
API: https://api.example.com/health
API response: seq=1 time=1ms status=0 (DOWN) uptime=0.0%
google response from 142.250.191.142: seq=1 time=394ms status=200 uptime=100.0%
amazon response from 98.87.170.74: seq=1 time=496ms status=200 uptime=100.0%
google response from 142.250.191.142: seq=2 time=410ms status=200 uptime=100.0%
That’s just the beginning. You can use webhooks when things are down, and even integrate Updo with logging tools and visualization tools like Grafana.
Testing in the Background
Running Updo in your terminal is good for basic testing, but for true monitoring, you’ll want to get Updo running as a service. The easiest way to do this is by running Updo on a Linux machine with systemd.
Install Updo on your server.
Then create the log directory:
sudo mkdir -p /var/log/updoPut your configuration file in the /etc/updo folder:
sudo mkdir -p /etc/updosudo cp ~/site-config.conf /etc/updo/Create a systemd unit file called updo.service that runs Updo with the configuration file and puts logs in the log directory:
[Unit]
Description=Updo Website Monitor
After=network-online.target
Wants=network-online.target

[Service]
Type=simple
ExecStart=/usr/local/bin/updo monitor --config /etc/updo/site-config.conf --simple --log
Restart=always
RestartSec=30
StandardOutput=append:/var/log/updo/updo.log
StandardError=append:/var/log/updo/updo.log

[Install]
WantedBy=multi-user.target
This also ensures the process restarts if it crashes.
Now install the unit file by moving it to /etc/systemd/system:
sudo mv updo.service /etc/systemd/system/Enable and start the service:
sudo systemctl daemon-reloadsudo systemctl enable updosudo systemctl start updoCheck its status:
sudo systemctl status updoNow you’re monitoring services in the background.
Conclusion
Updo gives you a lightweight tool you can use to actively check your sites’ uptime and responsiveness, with minimal infrastructure setup.